5 Powerful Visual Analytics Solutions

Not everyone is comfortable with diving into some of the complexities of analytics and lucky for them, there's another way to get a decent understanding of how users are interacting with a website (and its content) thanks to visual analytics solutions.
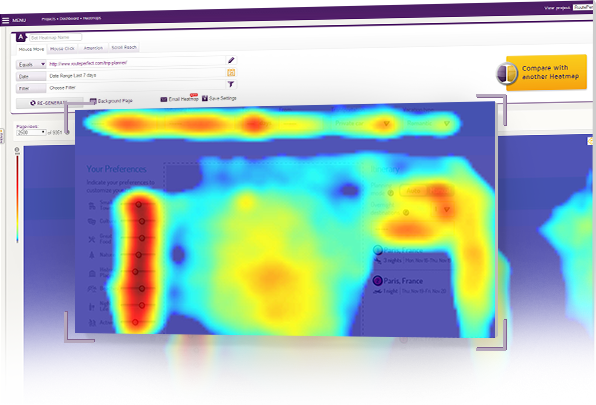
Heatmap software solutions, like the oft-mentioned Crazy Egg, do an excellent job of revealing action and interactions taken by users. For example, Crazy Egg can be leveraged to show website owners where people click on a site, how many people scroll down pages, where most people stop when scrolling, and much more. Plus, the platform's visual charts make it easy for professionals to analyze the results.
Discover five additional visual analytics solutions worth checking out below:
ClickTale
ClickTale makes it easy for Web pros to visualize the effectiveness of their website, thanks to heatmap analytics, on-demand session replays and charts that show Web pros the conversion paths consumers take on a website. The heatmap offering can be leveraged to see visitor mouse movements and clicks as well as how far visitors scroll. Conversely, ClickTale's session replay solution enables users to view individual customer experiences while the conversion funnel solution helps Web pros find out what aspects of a funnel are working and which are not.
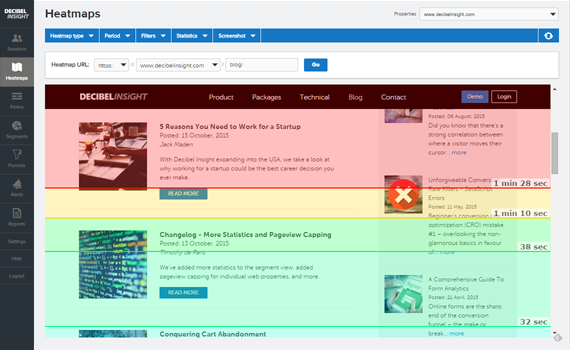
Decibel Insight
Decibel Insight offers both session replay and heatmap tools. Session replays enable users to see how audience members navigate their website, while the heatmaps enable users to gauge the effectiveness of page content, layouts, menus and more. In fact, users can track clicks, goals, hovering and scrolling, as well as filter and segment heatmap data.
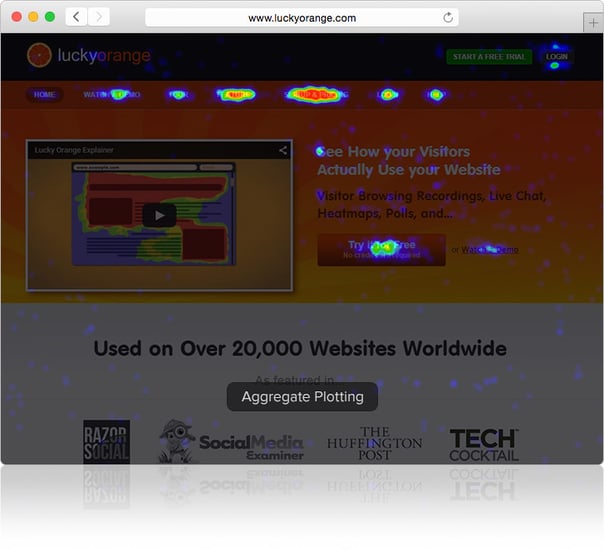
Lucky Orange
Lucky Orange offers heatmaps that track across devices and enable users to segment across location, browser, dates and more. The solution shows users where website visitors are clicking, tracks mouse movements and how far on a page a visitor scrolls. Plus, Lucky Orange's solution starts at just $10 per month, and offers additional features, such as session recording.
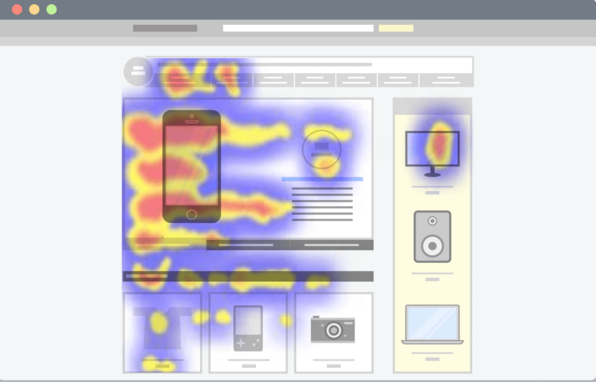
Visual Website Optimizer
Visual Website Optimizer offers a variety of analytics features, including heatmaps and clickmaps. The heatmaps, for instance, enable users to analyze visitors' click behavior and highlights distracting elements of a page. According to the company, mobile app Pair leveraged the heatmaps solution and found that its navigation bar was distracting visitors. After removing the navigation bar the app saw a 25 percent increase in conversions.
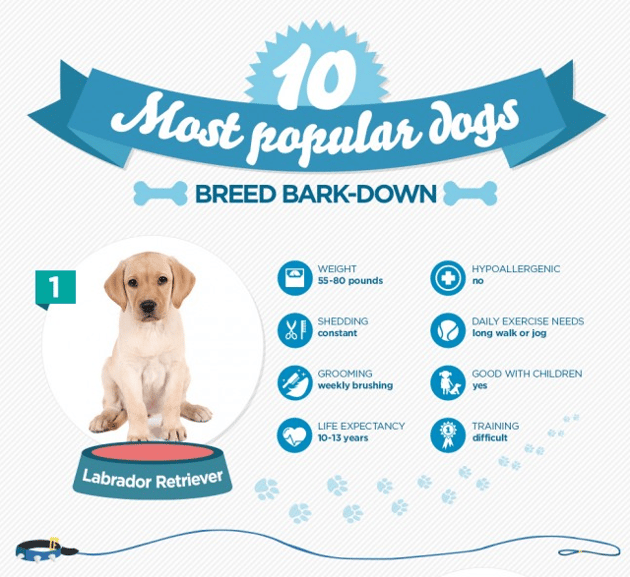
Visually
A bit different than the aforementioned solutions, Visually enables Web pros to turn their data into a visual presentation, such as an infographic or interactive website. The company matches users with a team of data scientists, designers and developers to create an informative design product. For instance, Nationwide insurance teamed up with Visually to create an infographic on how to choose the right breed of dog. The graphic compares the ten most popular breeds with important data, such as life expectancy, exercise and grooming requirements (see part of the graphic in the image below).