6 Facebook & Twitter Analytics to Track


Brands around the world are putting valuable resources, including time and money, into their social media initiatives every single day.
To make sure that these resources are not being wasted on the social Web, it is important for marketers to pay close attention to the performance of their social media campaigns. Fortunately, both Facebook and Twitter offer rather detailed insights into how well marketers are engaging their audiences.
By taking advantage of these insights (and looking past surface-level engagement metrics), marketers can measure the impact of specific content and use that data to optimize future campaigns. Read below to discover three of the most important metrics that marketers should be tracking on two of the 'Net's most popular social networks.
Most Internet professionals are familiar with Facebook's most basic (yet very important) metrics like reach and engagement. These metrics are valuable because they provide insight into the organic and paid visibility of content as well as allow users to measure how content is resonating with an audience by tracking interactions such as likes, comments and shares.
In addition to these metrics, however, brands should also be analyzing the rest of the data that the Facebook Insights dashboard offers. In doing so, marketers will learn more about their audiences and the performance of their Pages. Here are three of the dashboard's most important analytics that should not be overlooked:
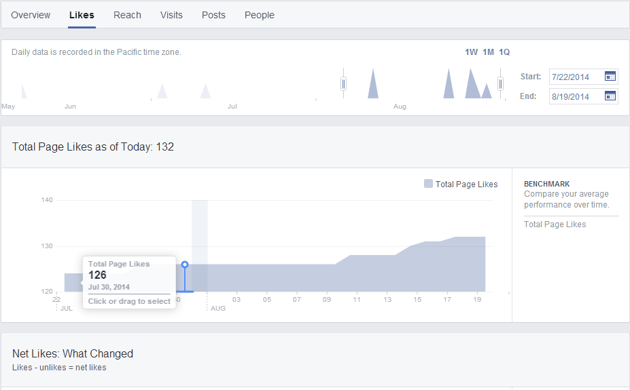
1) Likes - The "Likes" tab in the Insights dashboard enables users to see how many likes their Page has gained and lost each day as well as over a period of time. In addition to this data, the Likes tab enables users to identify where their Page likes come from - such as from the page itself, from posts, mobile devices or from Page suggestions. This information can help marketers identify what type of content or campaigns spark an increase in followers, so they can continue to build on that momentum by creating similar content or launching simiilar campaigns in the future.
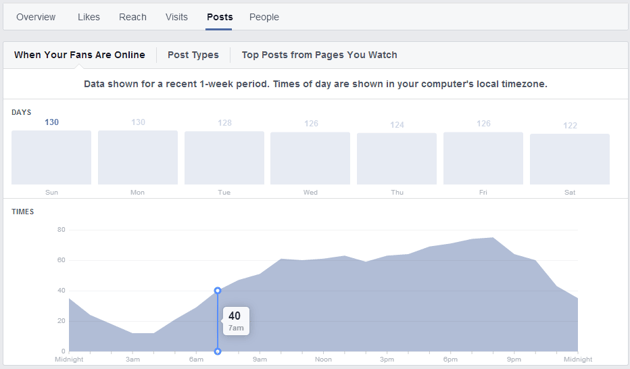
2) Posts - With the "Posts" tab, marketers can identify the days and times that their audiences are most active, view the success of different types of posts based on average reach and engagement, as well as compare the performance of their Pages and posts against competitors. This data can be leveraged to optimize future posting strategies. For example, if a brand's audience is most active on Monday evenings at 8 p.m., the company should consider posting content around that time in order to engage with more audience members.
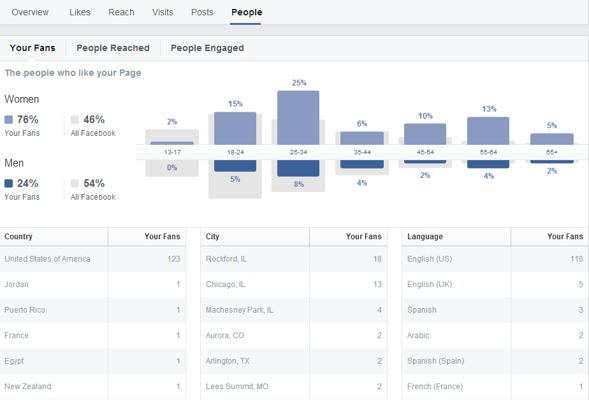
3) People -The "People" tab enables managers to discover more about the audience that likes their Pages and interacts with its content. For instance, users can view the age and gender demographics of their audience and compare that data to the rest of Facebook's member base. Users can also filter these demographics by people they have reached and people who have engaged with their brands. In addition, this tab breaks down the location of audience members by country, city and language. With these insights, brands can improve their targeting efforts when running an ad on Facebook by focusing on promoting content to audience members that are more likely to engage.
Twitter's analytics offering is pretty robust, and the social network is continuously enhancing it with new updates and functionality. Twitter users can access analytics either through the Twitter Ads platform or by visiting analytics.twitter.com.
The Ads platform, for example, offers campaign reporting for advertisers in addition to four dashboards - the Tweets, Followers, Twitter Cards and Websites dashboards. Conversely, those who visit analytics.twitter.com have access to the Tweets, Followers and Twitter Cards dashboards. All of these dashboards are jam-packed with data and insights that can be leveraged to measure audience engagement and optimize content for better performance on the social network. That said, brands should pay particularly close attention to these three analytics:
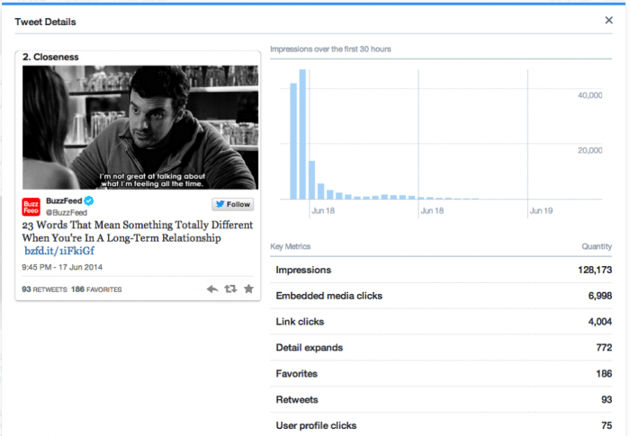
1) Link clicks - From the "Tweets" dashboard, users have the ability to view impressions and engagement metrics for both their Twitter activity over time and individual tweets. To learn more about the performance of individual tweets, users can click on each tweet to view more detailed reporting. This reporting includes data like the number of expands, user profile clicks, embedded media clicks, retweets and link clicks the tweet received. Marketers should pay especially close attention to the number of link clicks because this metric shows how content is resonating with their audience and if the content is engaging enough to persuade followers to take action and visit a website outside of Twitter.com.
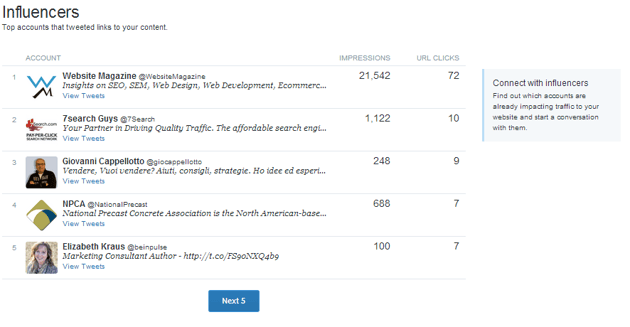
2) Influencers - In the "Twitter Cards" dashboard (note: you must use Twitter Cards to see insights on this dashboard), users can view a variety of useful stats, including impression numbers and metrics that identify a user's top performing Twitter Card content. In addition to that data, however, users should pay close attention to the Influencer section on this dashboard. In this section, marketers can view the top accounts that tweeted links to their content. With this information, marketers can focus on building better relationships with their most engaged audience members. This can result in more satisfied customers and even an increase in organic reach if the relationship-building efforts lead to audience members becoming more engaged with the marketer's content.
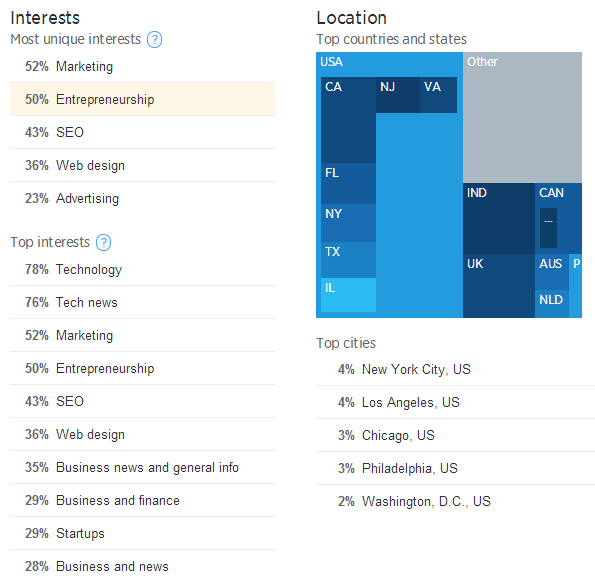
3) Top Interests - The "Followers" dashboard provides users with detailed data about audience members. From this dashboard, marketers can view a chart on their follower growth over time, as well as demographic data about audience members, like location and gender. Moreover, the Follower dashboard provides insights into follower interests, which is valuable because brands can leverage these insights to create more relevant content and better target audiences with advertisements on Twitter. For example, if the Top Interests section shows that 50 percent of a brand's followers are interested in SEO, the brand can launch a promoted tweet or account campaign that targets individuals who are passionate about SEO but not a follower yet.