Analytics for the Digital User Experience

By Chris Casale
Digital enterprises face the challenge of staying relevant and familiar in a constantly evolving world - just think about today's Facebook becoming yesterday's Myspace. Companies unable to change with their users face the risk of being left behind.
The good news is it's a challenge that can be met. Traditionally, analytics have been utilized by organizations to influence marketing and sales strategy. It's not enough anymore. Companies need to analyze and test their entire business model and the most logical place to start is the digital user experience - and designers can play an integral role in this process.
Getting Started
User data can be captured through a collection of tools or usability testing. Organizations that employ both of these methods will have a larger and more balanced data set to help influence their decisions.
Data collection tools come in all shapes and sizes, so businesses will have to experiment to find the one that's right for them. Free resources such as Google Analytics and Flurry (recently acquired by Yahoo - wsm.co/yflurry) are relatively straightforward to implement and provide a wealth of reports. Premium services such as HubSpot and Adobe Analytics also provide detailed reporting, as well as options for testing and customizing the user experience.
Usability testing is the act of putting an application in front of users and monitoring their interactions to see how easy (or difficult) it is to use. This type of testing can be performed in-house or by employing third parties such as UserTesting.com, ClickTale, Five Second Test and others (for more, check out "Big List of Usability Resources" at wsm.co/usability14). Some implementations can be more cost intensive than others, but designers should insist on usability testing being a part of the analysis process. Watching users interact with a product or service can provide valuable information that can shape the future direction of a user interface.
Once data analytics have been integrated, the next step is to sort through the reports and find the information that is most valuable.

Developers could see an increase in return usage by including a small icon that reminds users about the app's existence.
Metrics
It's easy to get inundated with the number of metrics available today. Unique visitors/uses, time-on-site/task, bounce rate, new versus returning - where does one begin? For starters, organizations need to avoid vanity metrics - anything that can be easily manipulated and does not generally correlate to the data that really matters. To analyze the user experience, enterprises need to look at engagement.
Simply put, engagement is the quality of the user experience. Do customers use the application, and in the manner it was intended, to successfully complete their tasks? Engagement will look different across various applications and services. Here are some metrics organizations can use to analyze their engagement:
Visitors / Unique Visitors
This may also appear as new versus returning visitors or sessions/users in tools like Google Analytics. The goal with this metric is to try and determine whether or not customers return to use the product or service. Visitors should be analyzed as a trend rather than a simple count. This becomes especially important to track as changes are made to the user experience. Designers need to know, are changes increasing the return rate or having a negative impact?
Length of Session
The length of a user's session will need to be measured for each application's particular goal (only that company can define what that goal is) - depending on how fast or slow a site owner wants to move a user through his or her site. If the intention of the application is for the user to watch videos, play a game or something similar, for example, a longer session length is indicator of better engagement. If, however, the application is a search engine and the intention is to help the user find something quickly, success will be in the form of shorter session length.
Regardless of the goal, the length of a session should be analyzed as both an average and an individual count. Trends in the average session length may show the direction a company is headed, but a significant split in longer usage versus shorter usage may also indicate a problem. Organizations won't notice those discrepancies until they start segmenting the data.
Session Interval
The length of a session measures how long a user is actively using the application, while the session interval measures how long between uses. Clash of Clans, a freemium mobile video game developed by Supercell, for example, uses a reminder icon when certain game actions are complete to persuade the user to return to the game (see image on previous page).
A very simple email or push notification may make a big difference in return usage, but organizations need to know the average session interval before improvements can be made.
Bounce Rate or Exit Rate
The goal of measuring bounce or exit rate is to find out where in the process users are exiting. Are they viewing one page and "bouncing" off the site? Are they leaving halfway through the checkout process? Pages or screens with a particularly high exit rate may indicate a problem. These areas may also be great targets for user testing.
These are just some of the many metrics designers and organizations alike can use to track engagement. Once data analysis has started, it's time to coordinate a plan.
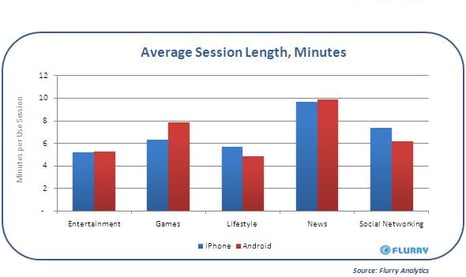
Compare Session Length By Device
The analytics tool Flurry allows developers to compare session length between devices (iOS and Android) as well as across different categories. This can help find problems with user experience across devices as well as help identify the category where the longest engagement occurs. It's About the User
In the end, it always comes back to the customer. Usability testing and data analytics can help organizations determine if their application is being used the way it was intended. They can also help enterprises decide where to make changes to improve the user experience.
As a designer, you should be involved in the analysis and decision-making process from the very beginning. It's imperative that any decisions made are based on actual evidence about how the product or service is being used and not based on personal opinion. Creativity is a vital part of the design process and, when influenced by user-data, designers can craft a truly great experience for users. That's a win for everyone.
Chris Casale is a software engineer with more than 18 years' experience architecting websites and applications. He is a regular contributor to the blog at www.araxam.com.