D3 and Why the Future of Content is Interactive

There's been a significant push the last few years for content (not just websites in general) to be more interactive. But how exactly does one do that? Help users visualize data about complex topics.
And how exactly can you do that? Consider D3 (short for "Data-Driven Documents") a framework that allows developers to build interactive visualizations and animations in the actual browser using web standards like HTML, CSS, and SVG. In essence, it lets you modify an HTML document live in the browser using data, offloading all the mathematical heavy lifting to a single JavaScript file.
You've probably already seen D3 in action on popular digital media outlets including Quartz, the New York Times, even the Washington Post (no wonder Bezos was so interested!). If you spend any time with D3 at all, you'll be a quick believer in its potential, but getting started isn't always easy. But don't worry, Website Magazine has got your back.
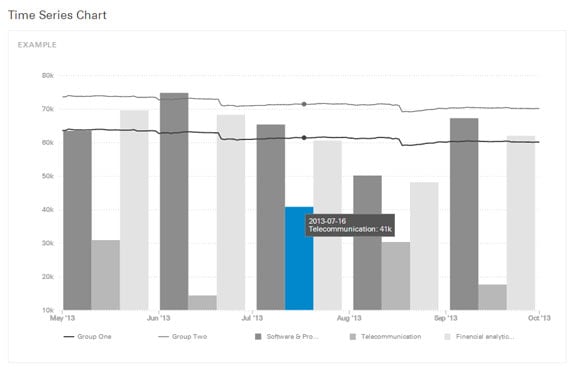
A new charting library caught our attention recently because it's actually built with Ember.js and D3.js frameworks. Ember Charts includes time series, bar, pie and scatter charts which are really easy to extend/modify and offers up a range or highly interactive feature including legends, labels, tooltips, even mouseover effects.