Google Analytics Can't Do It Without You

Google Analytics is a very powerful tool, but users need to fill a number of out-of-the-box gaps to fully understand source attribution, user actions and conversions.
Many users new to Google Analytics take a very basic approach to implementation and reporting: install the tracking code, and then begin accessing the default reports. These steps do provide a general idea of website performance, but the more specialized tactics outlined below help to build a much stronger foundation for insight and improvement.
Track Non-Pageview Actions
By default, Google Analytics collects website data only when a page loads and the tracking code executes. This doesn't account for a range of important user interactions, such as offsite links, PDF downloads, mailto: and tel: links, video plays/pauses/completions, entries into individual form fields, and any sort of animation, multistep process, or single-page application that does not cause an actual page load.
By taking advantage of JavaScript handlers such as onclick and onscroll, implementers can push events and virtual pageviews into Google Analytics to capture the full spectrum of visitor activity. The YouTube Player API, jQuery functions, and rule-based tagging in Google Tag Manager can also generate event and virtual pageview data.
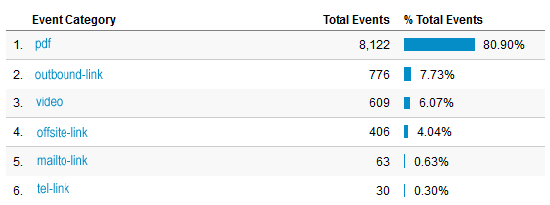
(Many important user actions, including PDF downloads, video plays, and outbound clicks, are not tracked in Google Analytics by default.)
Configure Goals and Funnels to Calculate Conversion/Abandonment Rate and Page Value
A Web analytics tool can't guess your business objectives. It's up to Google Analytics users to configure specific goals that align with their organizational KPIs.
Once a goal is created, Google Analytics begins to calculate the vitally important Conversion Rate metric. While some metrics can be ambiguous - increased time on site or pages per session for an ecommerce site could indicate either engagement or confusion - a conversion unequivocally signals a successful visit.
A goal can be configured with a funnel, which prompts Google Analytics to calculate the Abandonment Rate metric and render the highly useful Funnel Visualization report.
If populated during goal setup, the Goal Value field allows Google Analytics to report the extremely helpful yet woefully neglected Page Value metric, which indicates the pages viewed most often prior to conversion. Even for goals without direct monetary value, such as signup for a newsletter or an unpaid account, Page Value can greatly help to identify the pages that are contributing to conversions.
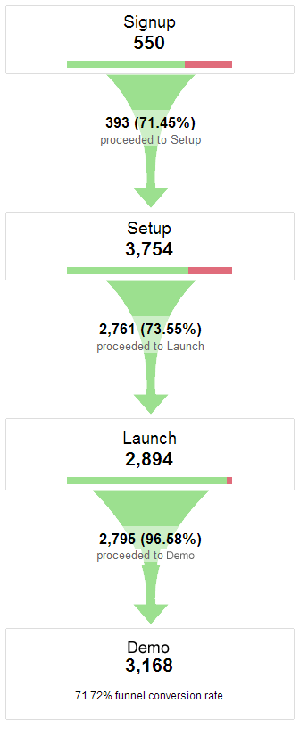
(Configuring a funnel as part of goal setup allows Google Analytics to calculate Abandonment Rate and populate the Funnel Visualization report.)
Consolidate URL Variations for Clearer Pageview Metrics
On many websites, visitors can access the homepage by URL variations such as www.mysite.com and www.mysite.com/index.php, which by default fragments Google Analytics pageviews between two different Page values : / and /index.php. To consolidate all pageviews of / into /index.php, specify index.php as the Default Page in View Settings.
A potentially bigger problem is URL query parameters such as session_id that do not significantly differentiate page content and should thus not be recorded for analytics purposes. These types of query parameters can result in thousands of URL permutations - far too many for reasonable analysis.
To simplify and consolidate URLs, list session_id and any similar query parameters in Exclude URL Query Parameters, also in View Settings. As a prior step, visit the Crawl , Üí URL Parameters report within Google Webmaster Tools to determine which query parameters to strip out of Google Analytics data.
As a note, best practice dictates the creation of at least two additional views per Google Analytics property: one to test new settings and filters, and one that remains completely raw and unfiltered as a backup.
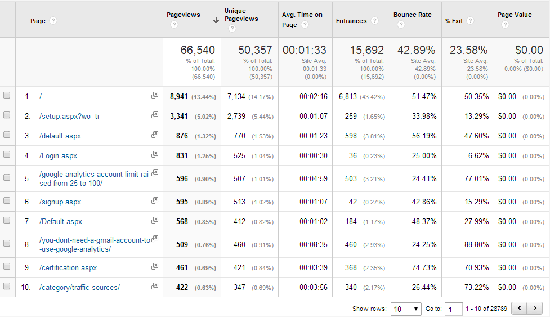
(This Pages report contains nearly 29,000 URLs. The Exclude URL Query Parameters setting can consolidate URL variations into a manageable number.)
Add Campaign Parameters for Clean Attribution of Inbound Links
For several types of traffic channels, Google Analytics needs assistance in the form of URL campaign parameters to avoid ambiguous attribution. The biggest culprits are perhaps email links that visitors have clicked in clients such as Outlook and Mac Mail, which Google Analytics records with direct instead of email as medium because the clicks cause the visitor's browser to open. For the same reason, inbound links from a PDF or a mobile app are also recorded by default as direct traffic, as are QR code redirects.
Clickthroughs from traditional and retargeting banners, affiliate sites and press releases are recorded as referrals, but it can be more useful to know that these visits originated from specific marketing campaigns rather than the multitude of websites on which the clicks occurred. Without campaign parameters (or Autotagging in the case of AdWords), pay-per-click visits are counted as organic, and some social clickthroughs may count as referral or direct.
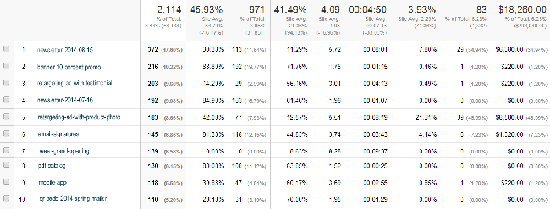
(Campaign parameters added to inbound links help to clarify source attribution for several types of traffic.)
Create Advanced Segments to Identify Audiences by Characteristics and Behavior
Important data points that hide in an unsegmented visitor pool can rise to the surface in reports that are segmented. Google Analytics provides a number of useful predefined Advanced Segments, such as Converters and Non-bounce Sessions, and users can define custom segments for even greater focus.
For a real estate website that serves both buyers and sellers, a Google Analytics user can create two Advanced Segments for visitors who are directed to either the buyer or seller welcome page after login. Once broken down to reflect visitor types, analytics data becomes vastly more actionable.
What about that $5k invested in a website video? Configure play and complete events for the video, create separate Advanced Segments for visitors who did and did not interact with the video, and apply the segments to goal reports. If the video segment shows a higher conversion rate than the non-video segment, the investment is probably paying off.
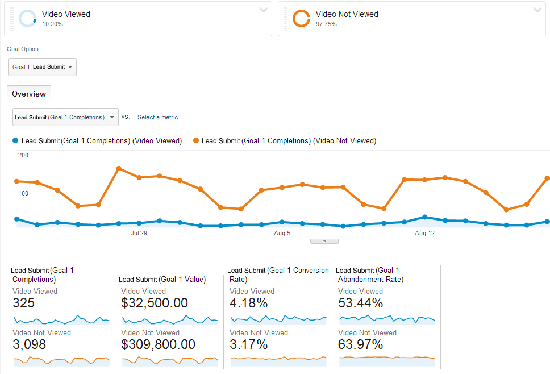
(Custom segments demonstrate that visitors who viewed a video converted at 4.18 percent rate, vs. a 3.17 percent rate for visitors who did not view a video - a 32 percent difference.)
Understand and Act
By filling the gaps in default implementation and reporting, Google Analytics users can better understand what is and is not working on their websites and take confident action for improving marketing ROI, visitor satisfaction, and overall value.