Responsive Charts with Pizza Pie


The demand for interactivity will likely reach fever pitch in 2014 as consumers start to expect more from their digital experiences. As a result, developers and designers must actively look for solutions in order to differentiate their presentations.
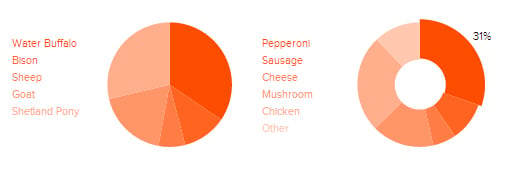
Website Magazine covered the D3 framework (Data-Driven Documents - https://wsm.co/1bCadoL) back in early November and suggested then that it was the future of digital content development, but learning an entire framework isn't totally or absolutely necessary if what all you really need is just some better visualization in general. If that sounds like your situation, perhaps you need to check out Pizza Pie Charts from Zurb, a responsive pie chart based on the Snap SVG framework from Adobe.
The plugin is built with Zurb's popular responsive framework Foundation (so it's bound to look pretty sharp on retina devices and HiDPI devices). Just include the plugin in the footer of the page where the chart(s) will reside and include the CSS in the head section. What's appealing about Pizza Pie is that it's very straightforward to pull together from an HTML coding perspective - nothing more than a list and few data attributes and you're off and running. The chart itself can even be styled with the CSS extension language SASS and all that's left is to initialize the pie charts.
Easy as Pizza Pie! Check out Pizza Pie Charts over at Github.