Web Design Visualization Tools You Might Have Missed

Whether its to get consumers to purchase a product or to get potential volunteers to sign up and donate their time to a good cause, each website has a unique goal. Unfortunately, not every website connects with consumers the way brands intended causing consumers to not realize the true intentions of the website.
To help brands track website traffic and determine what areas of their websites are connecting with consumers and what areas are missing the mark, checkout out the five visualization tools below.
Crazy Egg
While many analytics platforms deliver data such as time on site and number of backlinks to its users, Crazy Egg takes a much more visual approach by focusing on heatmaps and scroll maps. Through Crazy Egg's heatmaps businesses are able to see which individual parts of their Web pages are connecting with their consumers and which are not (the deeper the red the greater the consumer interest). Also, Crazy Egg helps businesses decide where to put content by delivering a scrolling tool that tells them how far down site visitors are making it on the page. What's more, Crazy Egg also enables businesses to identify how visitors arrived on their sites.
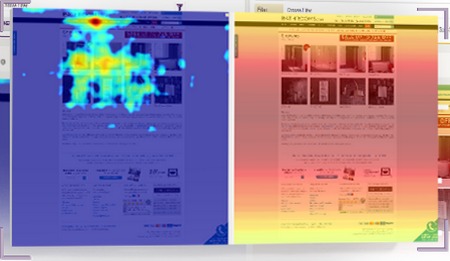
Clicktale
While many traditional analytics platforms offer dashboards to help brands visually understand the complicated information that they accrue, few provide session playback for individual customers. Through this feature brands are able to see exactly how users interact with their site and see first-hand what aspects of their sites are connecting with visitors and what is not. What's more, Clicktale enables brands to view a side-by-side comparison of heatmaps for pages that are being A/B tested.
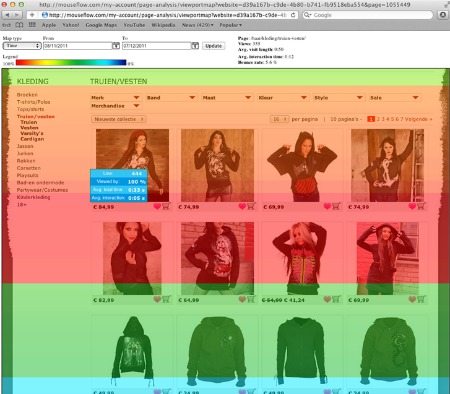
Mouseflow
Combining some of the best aspects from Clicktale and Crazy Egg, Mouseflow enables users to not only follow site visitors throughout their entire journey on the site via live mouse tracking but it also allows brands to see what elements are hot and what are cold thanks to heatmaps. Furthermore, Mouseflow delivers additional analytics to users including information on visit length, interaction time and number of clicks.
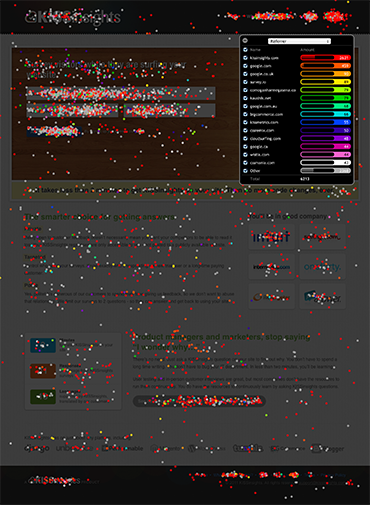
gemius HeatMap
Much like the others on this list, gemius HeatMap enables its users to see how users act while on their site through, as you guessed it, heatmaps. However, what sets this platform apart is the ability for users to monitor the performance of specific features and sections of the site. Through this technology brands are able to see how consumers are connecting with the content on the bottom left of their website or how often they are using the top menu bar.
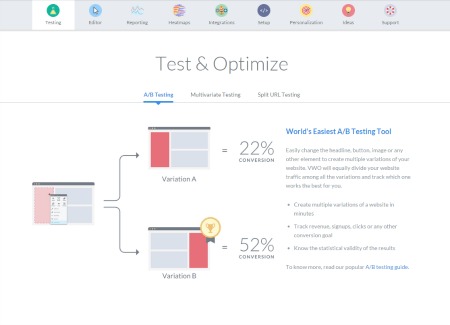
Visual Website Optimizer
One of the most comprehensive testing and feedback solutions available, Visual Website Optimizer enables brands to not only leverage heatmaps to discover the hot and cold areas of their website, but also receive detailed analytics and build campaigns visually. Also, thanks to its A/B testing tool, Visual Website Optimizer lets brands test different variations of their sites and see how they impact a variety of statistics including clicks and any conversion goal they set.