Best Distribution Channels for Your Content

Content marketing is as much about producing assets (articles, infographics, whitepapers, videos) as it is promoting it (not to mention analyzing audiences, trends and results). Since there are so many channels to distribute content to (it is our recommendation to publish content on your website and feed it to other channels), marketers have to do their due diligence to ensure they are spending their time and money (in the case of paid opportunities) in the most optimal ways.
Based on a collection of stats, find out which top channels generate the highest response in terms of engagement and conversion below (then you be the judge).
+ Despite the assumption that most consumers favor brief interactions across social channels, more than two-thirds actually prefer brands to communicate with them via email (source).
+ For ecommerce, the average conversion rate for email newsletters is 1 percent, for order follow-up emails it is 2.6 percent and for abandoned cart emails it is 5 percent (source).
+ Eighty-three percent of all email-driven shoppers make at least one more return visit, while search and social don't crack 75 percent (source).
+ Email works better with shoppers who have made multiple purchases with a retailer ($101.94 AOV, 5.2 percent conversion rate) than with shoppers who have only made a single purchase in the past ($95.05 AOV, 3.7 percent conversion rate) according to Monetate's Ecommerce Quarterly Q1 2017.
Social (Organic)
+ According to that same Monetate report, social works better as a return-visit mechanism for shoppers who have no previous history with a retailer ($128 AOV, .9 percent conversion rate) than with shoppers who have previous browsing history with a retailer ($90.34 AOV, 0.6 percent conversion rate).
+ People are 16 times more likely to read a post from a friend than from a brand (source).
+ Sixty percent of people say they learn about a product or service on Instagram (source).
+ From February 2017 to March 2017, over 120 million Instagram users visited a website, got directions, called, emailed or direct messaged to learn about a business (source).
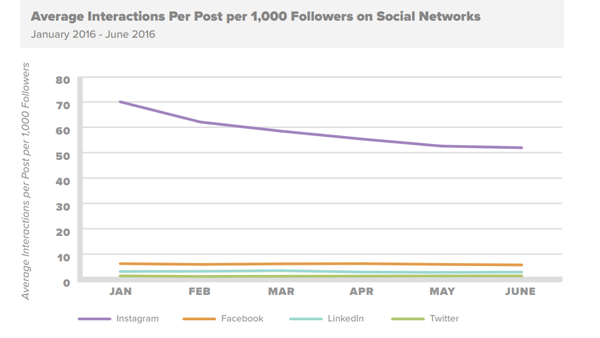
+ From January 2016 through June 2016, the engagement ratio - or average interactions per post per brand per 1,000 followers - decreased on Facebook, LinkedIn and Instagram (source).

(Image via TrackMaven)
+ Surprisingly, the Wine & Spirits industry is the winner on LinkedIn with the highest average number of interactions per post (385). Diageo, the parent company to myriad liquor brands, including Guinness, Smirnoff, Johnnie Walker and Tanqueray, leads the Wine & Spirits industry on LinkedIn by engagement (via TrackMaven).

+ On Facebook, newspapers, broadcast media, online media, media production and publishing are the industries with the top posting frequency according to TrackMaven;

but they are not present in the top 10 industries on Facebook by average interactions per post indicating less might be more for publishers distributing their content on Facebook. The data might also indicate people's willingness to like companies that distribute content frequently but have little plans to engage with it or that publishers are simply not targeting audiences the way they should to optimize engagement.

+ TrackMaven reports that businesses in the broadcast media, online media, media production and newspapers industries rank in the top 10 for both highest average Twitter followers and highest average tweets per month.

However, from an engagement standpoint, the music industry leads the pack on Twitter. This perhaps indicate people's willingness to skim through content on social but not actually engage.

Social Media (Paid)
+ Seventy percent of performance campaigns on Instagram generated statistically significant lifts for online conversion or mobile app installs (Instagram Internal Research two months: May-July 2016). And, the value of ads extends beyond mobile, contributing to a 2 percent lift in offline sales (source).
+ Fifty-six percent of Facebook users say they have clicked on an advertisement (source).
+ The average click-through rate (CTR) in Facebook ads across all industries is .90 percent (source).

Pay Per Click
+ The rate for social ads on Facebook has risen by 54 percent over the last year, while the rate for cost-per-click search ads rose by 8 percent during the same period ( source).+ Across industries, the average conversion rate for PPC ( per this sample) in 2016 was 6.5 percent.
+ The average click-through rate on AdWords paid search ads is about 2 percent ( source).

While there are certainly more channels to distribute content to (third-party blogging sites, content curation sites, industry blogs, etc.), marketers should get a good idea of the performance of the top channels by sifting through and saving these stats.


