5 Reasons Visitors Leave Your Website and Website Tracking Tools to Track Website Visitors


There is nothing more satisfying than having your work appreciated through a comment, a like, a tweet or a sale. Unfortunately though, it is becoming harder and harder to get that appreciation or attention from visitors.
Since we live in an era of skimming and in a time where information is not scarce, keeping the visitors enticed enough to stay on a website for more than a few seconds is getting harder. It can be a struggle to convince visitors that their time on your site will be worthwhile.
Here is a scary statistic that inspired the creation of this article: On average, a visitor will leave your website in 10-20 seconds.
So, we’ll take a look at 5 reasons why someone would do that. If your website suffers from a high bounce rate problem, this one's for you!
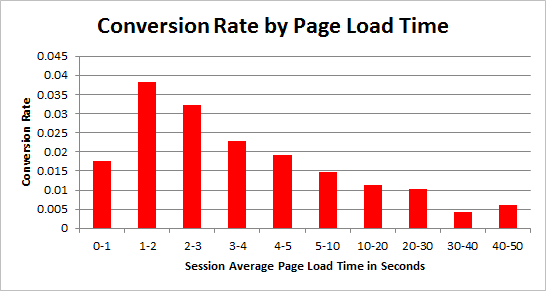
1) World Wide Wait: a.k.a Slow Loading Website Pages
According to Kissmetrics, 47 percent of visitors expect a website to load in less than 2 seconds, and 40 percent of visitors will leave the website if the loading process takes more than 3 seconds.
Before we look at studies that have examined the loading speed problem, here is some interesting information that may shed some light upon how the visitors' expectation changes with an increased loading time.
People like to be in control of their destiny and not be subjected to the computer's whims. In his book - Usability Engineering, Jacob Nielsen talks about 3 important time limits that occur during the delay between a user’s action and the application’s response.
a) 0.1 second:
If the application responds instantaneously to the user's actions, it gives an appearance of direct manipulation. It makes the user think that the result was generated by their action and not by the computer. This phenomenon of direct manipulation is a great key to increase user engagement.
b) 1 second:
If the response interval time is 1 second, the user will notice the small delay and feel like the system is generating the results instead of them, but they will focus more on their train of thought, after which they retain the sense of control a little. A Web page should ideally take one second to load to give the users the feeling that they can navigate freely.c) 2 second:
If a website takes longer than 2 seconds to load, it can result in a poor user experience, leading to potential consequences such as:
Increased bounce rate:
Visitors are more likely to leave the website if it takes too long to load, leading to a higher bounce rate.
Decreased engagement:
Visitors may become frustrated and disengaged with the website if it takes too long to load, leading to a decrease in engagement.
Decreased conversion rates:
A slow-loading website can result in decreased conversion rates, as visitors may be less likely to complete a purchase or sign up for a service.
Damaged reputation:
A slow-loading website can damage the reputation of the website and the brand, as visitors may associate slow loading times with poor quality or inefficiency.
Google considers load time as a factor while ranking websites. The reason is simple: Google wants to rank websites with a better user experience higher than others and loading time is an important factor here, which decides how the users’ experience on your website will be.
Tagman, a tracking system provider, worked with an online prescription glasses retailer, Glasses Direct, to study the effects of loading speed on consumer conversion. The interesting part was that every one-second delay caused a 7 percent loss in conversions.
(Image source: Tagman)
When Amazon analyzed its ratio of sales to its Web performance through A/B tests, what it found was that with every page load delay of 100 milliseconds there was a 1 percent decrease in conversions.

(Image source: Walmart)
Last year, Walmart reported that by reducing their page load time by one second they saw a 2 percent increase in traffic, and every 100-millisecond decrease of page load time saw an incremental conversion of 1 percent.
With each passing year people's willingness to wait is becoming lesser and lesser. In a New York Times article titled, "For Impatient Web Users, an Eye Blink is Just Too Long to Wait," it was reported that, according to Google engineers, even 400 milliseconds was too long.
The game of speed is slowly shifting from seconds to milliseconds. Where do you stand? Want to check your website's performance? You can do so through Web Page Test.
How to Track Your Website’s Page Load Speeds
Google Analytics has a site speed metric that allows you to track the average page load time for your website's visitors. You can access this metric by navigating to the "Behavior" section, then "Site Speed," and finally "Overview." This will give you a general view of the average page load speed for your website, as well as other related metrics such as the number of pageviews and average load time by browser.
Google Search Console's Core Web Vitals is a similar tool that provides data on user-centric metrics that indicate the loading performance, interactivity, and visual stability of your pages. It helps you to identify any potential speed issues and provides suggestions for improvement. To access this information, go to the "Core Web Vitals" report in Google Search Console.
To track website visitor page load speeds using Google Search Console's Core Web Vitals, follow these steps:
- Access Google Search Console
- Navigate to the "Core Web Vitals" report
- Review the provided data for the metrics: Largest Contentful Paint (LCP), First Input Delay (FID), and Cumulative Layout Shift (CLS)
- Look at the metrics over time and identify any potential issues with slow page load speeds or stability.
Google Search Console will provide information on how your website's Core Web Vitals scores compare to industry standards and highlight any areas that need improvement. You can also use this data to prioritize optimization efforts and monitor changes to your website's performance over time.
2) Dysfunctional Website Layout
Another reason why a substantial amount of your traffic might “bounce” could be because of your website's structure. The solution is a website revamp.
Remember, users don’t actually read your content – they scan content. You can think of an un-optimized Web design as a communication problem whereby your targeted audience fails to clearly grasp or retain the key elements needed to make a decision (a click, opt-in, etc.) during their stay on your website.
There are many design principles and failure to implement them could be a reason behind the high bounce rate.
For example, having a visual hierarchy tells readers what to read and in which order. More importantly, it is a fantastic way to embed a sense of importance within the reader's mind.

People don't see everything equally; rather they organize. They can organize any content in the order of importance just with a quick glance, even without knowing what it actually is about.
Visual Website Optimizer (VWO) is a leading A/B testing tool. Underwater Audi, an online retail store, used VWO to optimize their homepage for conversion. They wanted to see if visual hierarchy in application would produce any significant improvements.
This was their original homepage:

(Image source: Visual Website Optimizer)
Their goal was to rearrange the elements in an F-shaped format to stay in sync with how humans read text online. They swapped the call to action “learn more” with the testimonial bubble to make the image more visible.
Result? Such a small change resulted in a 35.6 percent increase in sales.
Another one is the Hicks' law, which is a contribution by William Hicks to experimental psychology. It states that a visitor's reaction rate is directly proportional to the amount of choices you present them with. Sometimes choices can be demotivating.
If your blog contains many articles across various topics, implement a more robust filtering system through which the users can eliminate the distractions and find what they are looking for, faster.
How to Track Website Visitor Page Interactions
Tracking website visitor's page interactions using analytics tools can provide valuable insights into how users are interacting with your website. Here are some of the ways you can track website visitor's page interactions using analytics tools:
Event tracking:
This feature in Google Analytics allows you to track specific user interactions on your website, such as clicks on a button or a link. You can set up event tracking by adding a small piece of code to the elements you want to track.
Scroll depth tracking:
Scroll depth tracking allows you to track how far down the page users are scrolling. You can use this information to understand how engaging your content is and make improvements to increase user engagement.
Heat mapping:
Heat mapping is a visual representation of where users are clicking on your website. Heat mapping tools like Hotjar or Crazy Egg can help you understand which areas of your website are getting the most attention and where you can make changes to improve the user experience.
Session recordings:
Session recordings allow you to watch a video of a user's session on your website, including mouse movements, clicks, and scrolling behavior. This can provide valuable insights into how users are interacting with your website and help you identify any pain points in the user experience.
By tracking website visitor's page interactions, you can gain a better understanding of how users are interacting with your website and make informed decisions about how to improve the user experience.
3) Kill Autoplay Content
A video that plays by itself turns into an irritant for the visitor, whose only goal then becomes to find the tab where the audio is playing and close it. It is important to remember that your visitor might not be at the comfort of their home, but instead maybe at work, or school or at some place where watching a video is not appropriate.
Secondly, visitors like to think that they are in charge of their actions. Having the video play automatically without them having to initiate any action on their part is a poor usability technique. Your visitor might already be listening to their favorite music while visiting your website. By forcing your video or audio content upon them, you are only giving them more reasons to close your Web page.
Web Content Accessibility Guidelines (section 1.4.2) states that if an audio is automatically played for more than three seconds, an option should be shown to the visitor whereby they could pause or mute the audio. This option should be independent from the systems' main volume controller.
Facebook recently launched autoplay ads on its newfeed, and in less than 24 hours we already have Web users searching for ways to block these “annoying ads”.
In a survey based on 605 participants, it was found that 70 percent of them found ads that played automatically sounded very negative.
Although there haven't been any major research done on whether the presence of auto playing videos increases the likelihood of people leaving your website, just a quick search on popular forums will return comments like this:
"One time I really needed some info on this page and it was blaring some cheesy tween pop song. I was in a crowded room and quickly scrolled through the page to get the info and then slammed the laptop shut like it was a ticking time bomb." ~ Karen
But if you know that the majority of your visitors read your website from a cubicle, for example, video play should always be user initiated.
How to Test Web Page Content Using A/B Testing
A/B testing is a method of comparing two versions of a website to determine which one performs better. Here are the steps to track website visitors using A/B testing:
-
Identify the goal:
Determine what you want to test and what metric you want to measure (e.g. click-through rate, conversion rate, time on page, etc.).
-
Create two variations:
Create two versions of the website, each with a different element or design that you want to test.
-
Randomly split traffic:
Use a tool such as Google Optimize or Optimizely to randomly split traffic between the two variations. This ensures that each visitor has an equal chance of being assigned to either version.
-
Track results:
Use analytics tools such as Google Analytics to track the key metric you have selected and compare the results between the two variations.
-
Analyze results:
After collecting data for a sufficient period of time, analyze the results to determine which version performed better and why.
-
Implement the winning variation:
Based on the results of your A/B test, implement the version that performed better as the permanent version of your website.
A/B testing is a valuable tool for improving the performance of your website and can provide valuable insights into what works and what doesn't work for your audience. Repeat the process regularly to continually improve the user experience and drive better results for your website.
4) Your Content is Boring!
Many website owners spend an awful amount of time making their homepage interesting, and push the rest of the pages to the back burner. Think about this: When was the last time you actually entered a website through the homepage?
Over the years, search patterns have drastically changed. According to Forrester Research, in 2012, 54 percent of consumers found websites through search engine results, 32 percent through social networks, and 28 percent said that they found websites through links from other websites. Curiously, in HubSpot’s 2023 State of Inbound Market Report, social media accounts for 16%, while referral traffic accounts for 9%. According to aHrefs, organic search still accounts for 53.3% of all traffic in 2023.
Homepages are not a website's main entry point anymore. It is important to note that articles, blog posts or any other content that you add on your website is also attracting traffic, which is why it is absolutely crucial to make each and every page compelling.
According to the Nielsen Norman group, “the most effective Web content is objective and neutral”. Instead of using technical terms, complex words and jargon, the meaning of Web content should be easy to comprehend.
Focus on writing thorough articles instead of short blog posts. If you are selling a not-so-cheap product, writing interesting articles is the way to go because higher-priced items, unlike cheap products, have a long sales cycle, which means that you need to form a relationship with your readers and prove your credibility before seeing a sale.
If your website targets older demographics, you will find this interesting. According to a study done by Nielsen and Norman group, they found that users who are 65 and older are 43 percent slower at using websites than their 21-55-year-old counterparts.
Plus, don't forget the power of typography – it can affect your readers' experience and conversions.
Make your content more interesting by making it more relateable and reactable.
Another effective way to let your web page stand out is to consider integrating other branding and marketing elements, including vanity phone numbers for example, into the design.
How to Track and Measure Visitors Content Consumption on Your Website
Here are some ways to track how website visitors consume content:
Scroll tracking:
Use tools like Google Analytics or Hotjar to track how far down the page visitors are scrolling. This can help you understand how engaging your content is and where you may need to make changes to improve user experience.
Time on page:
Use tools like Google Analytics to track the average time that visitors spend on a page. This can help you determine which pages are most engaging and which may need improvement.
Exit rate:
Use tools like Google Analytics to track the exit rate, which is the percentage of visitors who leave your website after viewing only one page. High exit rates may indicate that visitors are not finding what they are looking for or that the content is not engaging enough to keep them on the site.
Content grouping:
Group similar content together in Google Analytics and track the performance of each group. This can help you determine which types of content are most popular and where you should focus your efforts.
Heat mapping:
Use tools like Hotjar or Crazy Egg to create heat maps of your website. This can help you understand which areas of the page are getting the most attention and where visitors are clicking.
By tracking how visitors consume content, you can gain valuable insights into their behavior and preferences, and make informed decisions about the type of content to produce in the future.
5) Outdated Content
Another big reason why people would leave your website is outdated content. If they have nothing new to read, why would they stay? It is very essential to have a rhythm in your postings and it is just as important to stick to those posting schedules. A content calendar is one way to achieve this.
There hasn't been any research done to find the perfect frequency of blog postings, but it is important to not keep your visitors guessing as to when your next content will be published. An ideal frequency will depend on your niche. Sometimes posting too often can irritate the readers causing them to un-subscribe. It can also increase the chances of filler posts- something that your readers will not appreciate.
Posting less frequently will make your readers lose touch with your blog. It is harder to keep a loyal reader base when they have nothing to read.
According to a 2022 survey of 1016 bloggers, 80% reported regularly posting blog content delivers results. About 66% of bloggers publish weekly, monthly, or somewhere in between (Orbit Media).
Leading tech websites update their blogs several times every hour. The important point to takeaway is to find that middle ground where your users will appreciate your postings and even look forward to it.
How to Identify and Track High Interaction Pages Worth Updating
Tracking high-interaction pages on your website can help you understand which pages are most important to your visitors and when you should update them. Here are the steps to track high-interaction pages:
Identify high-interaction pages:
Use tools like Google Analytics to identify the pages on your website that receive the most traffic and have the highest engagement levels.
Track metrics:
Track key metrics for each high interaction page, such as pageviews, time on page, bounce rate, and conversion rate.
Monitor changes:
Monitor changes in these metrics over time to determine if there are any patterns or trends that indicate a need for an update.
Review feedback:
Regularly review feedback from your visitors and use this information to identify any areas where updates may be needed.
Determine the right time to update:
Consider factors such as the seasonality of your business, the age of the content, and any changes in user behavior or technology when determining when to update high-interaction pages.
By tracking high-interaction pages, you can ensure that your website remains relevant and engaging for your visitors, and make informed decisions about when to update content to improve the user experience.
The frequency at which search engines look for updated content varies and depends on several factors, including the size of the website and the volume of changes. However, it is common for search engines like Google to crawl and index websites on a daily or weekly basis. This means that changes to your website can potentially be picked up by search engines within a few days.
However, it's important to note that just because a change is made to a website, it doesn't guarantee that the change will be immediately reflected in search engine results. Search engines use algorithms to determine the relevance and quality of content, and it can take time for these changes to be reflected in search engine rankings.
Ultimately, the frequency at which search engines look for updated content may vary, but it's important to regularly maintain and update your website to ensure that it remains relevant and engaging for both visitors and search engines.
Top 10 free website visitor tracking tools for 2023:
Knowing what your visitors are doing on your website is the best way of determining what they want and how to keep them happy. Here are 10 website analytics tools to help you do just that!
-
Google Analytics 4:
- Google Analytics 4 (GA4) is the latest version of Google Analytics and it comes with a new and improved set of tracking tools to help you analyze and understand your website's performance. Here are some of the tracking tools available in GA4:
- Tracking Code: The GA4 tracking code is a piece of JavaScript that you add to your website's code. It allows GA4 to collect data about your website's visitors and their behavior.
- Events: Events in GA4 allow you to track specific user interactions with your website, such as clicks on links, video plays, form submissions, and more. You can use events to gain insights into how users engage with your website and to measure the effectiveness of your marketing campaigns.
- Enhanced Measurement: Enhanced measurement is a new feature in GA4 that automatically tracks some user interactions on your website, such as pageviews, scrolls, and outbound clicks. This feature can save you time and help you gain a more complete understanding of your website's performance.
- E-commerce Tracking: E-commerce tracking in GA4 allows you to track transactions, revenue, and other e-commerce-related metrics. With this feature, you can see which products are selling well and optimize your online store for better conversions.
- Custom Dimensions: Custom dimensions in GA4 allow you to create your own user-defined dimensions, such as user type or product category, to help you gain a deeper understanding of your audience and their behavior.
- Goals: Goals in GA4 allow you to measure specific actions that users take on your website, such as signing up for a newsletter or making a purchase. By tracking these actions, you can identify areas where your website is performing well and areas where you need to improve.
- Funnels: Funnels in GA4 are a series of steps that users take on your website to reach a specific goal, such as completing a purchase. By tracking the conversion rate at each step of the funnel, you can identify areas where users are dropping off and optimize your website to improve the conversion rate.
-
Matomo:
Matomo is an open-source analytics platform that enables users to track and analyze their website traffic and user behavior. Matomo provides a powerful set of tracking tools that allow users to gain insights into their website's performance and optimize it for better engagement, conversions, and revenue.
In 2022, Matomo was named the best software of the year by the CMS Critic Awards. This recognition highlights the quality of the platform and its ability to help businesses and organizations effectively track their website metrics and make data-driven decisions to improve their online presence. With Matomo, users have access to a customizable and privacy-focused analytics solution that provides accurate data without compromising users' privacy.
-
Fathom Analytics:
Fathom Analytics is a web analytics platform that allows businesses and website owners to track and analyze their website's performance. Fathom provides a simple and easy-to-use dashboard that allows users to gain real-time insights into their website traffic, including tracking metrics such as page views, bounce rates, and referral sources. Fathom's focus on privacy means that it does not use cookies to track users or collect any personal data, making it an ideal choice for businesses that want to avoid the ethical concerns associated with more invasive tracking tools. With Fathom Analytics, website owners can track their website's performance while respecting the privacy of their users.
-
Clicky:
Clicky is a web analytics platform that provides businesses with real-time analytics and a range of tracking tools. With Clicky, users can track website metrics such as visitor behavior, engagement, and conversions, allowing them to optimize their website for better user engagement and revenue. Clicky's focus on real-time analytics and its customizable tracking solution make it a great choice for businesses that want a comprehensive web analytics platform.
-
Piwik:
Piwik Analytics is an open-source web analytics platform that allows businesses to track and analyze their website's performance. Piwik offers a customizable tracking solution, including tracking tools such as goals, events, and e-commerce tracking. Piwik's focus on privacy and anonymized data ensures that businesses can track their website's performance without compromising their visitor's privacy. Piwik's customizable dashboard allows users to create their own reports and visualizations, making it a great choice for businesses that want a fully customizable and privacy-focused web analytics solution.
-
Yandex Metrica:
Yandex Metrica is a web analytics platform that offers real-time tracking tools to help businesses and website owners understand their website's performance. Its focus on user behavior enables users to optimize their website for better engagement and conversions, and its reporting and visualization tools provide a concise format for actionable insights.
-
Mixpanel:
MixPanel is a product analytics platform that helps businesses understand how users interact with their products. With MixPanel, users can track and analyze user behavior, including funnel analysis, retention rates, and engagement metrics. MixPanel's focus on product analytics enables businesses to optimize their products for better user engagement and retention.
-
Heap:
Heap is a web and mobile analytics platform that provides businesses with a simple and easy-to-use tracking solution. With Heap, users can track website metrics such as pageviews and clicks, as well as user behavior, including funnels and conversion rates. Heap's focus on simplicity and ease-of-use makes it a great choice for businesses that want a hassle-free tracking solution.
-
Mouseflow:
Mouseflow is a web analytics platform that allows businesses to track and analyze visitor behavior. Mouseflow's features include heatmaps, session replays, and funnels, enabling users to optimize their website for better user engagement and conversions. Mouseflow's focus on user behavior enables businesses to identify areas for improvement and make data-driven decisions.
-
Hotjar:
Hotjar is a web analytics platform that provides businesses with a range of tracking tools, including heatmaps, session replays, and funnels. With Hotjar, users can analyze visitor behavior and optimize their website for better user engagement and conversions. Hotjar's focus on user behavior and its range of tracking tools make it a popular choice for businesses that want to gain a deeper understanding of their website's performance.
These are just a few of the many free website visitor tracking tools available, each with its own unique features and capabilities. When choosing a tracking tool, consider your specific needs and budget, and compare several options to determine which is best for your website.
A few words about email
One of the main reasons you want visitors to stay on your site is so that they consume your content and eventually exchange their email addresses for something of equal value. But what if you could capture and email prospects who have already opted into sites on a proprietary data network? Customers.ai automatically scans website visitors against 100+ million opted-in users and enables companies to send previously opted-in visitors automatic emails without having them subscribe through a form on their website.
I hope this article was helpful. As website owners, our goal is to attract traffic and keep them on our site for as long as possible. Often, we get so involved in making the website “pretty” and “cool” that we forget what our users actually want to see. Fortunately, with so much marketing research and case studies available we can pinpoint as to why exactly something that looks perfect is not actually converting.
A visitor's goal is not to leave your website; it is to find the solution. If we can show them effectively and fast that we hold the answers to their problem or question there is no reason why they would leave your website.