KAYAK Provides Important Travel Industry Data


KAYAK, a travel comparison site has a wealth of data. And now it's open to anyone who wants it.
Two features, a trends page and KAYAK Travel Index provides some valuable knowledge about user travel search preferences that should come in very handy for anyone in the travel industry - bloggers, affiliates and advertisers included.
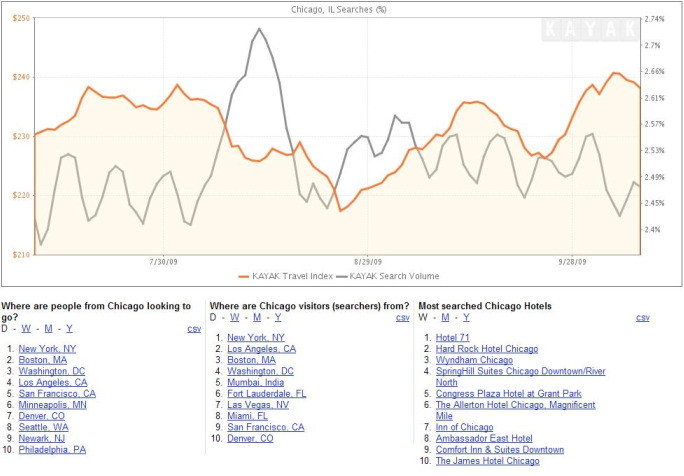
The trends page gives details into such metrics as Most Popular Destinations, Biggest Upward Trends and Biggest Downward Trends. Click on a city and a graph appears, showing search trends for that city, pulled from "hundreds of millions of searches over the past 12 months on KAYAK sites," according to the website. Some of the data includes where particular city residents are looking to go, where visitors to that city are searching from and the most searched hotels in that city. One of the nice features is that pricing data comes from actual user selections, not just airline or hotel pricing itself. You can also save the trends data in an Excel file.
The KAYAK Travel Index shows a measure of demand. The inital page shows overall demand (in terms of dollars booked) for all destinations searched, or you can enter a specific airport city name and get some more detailed data. For instance, travel searches for Chicago peaked in mid-August this year, while actual bookings seem to be highest in October of this year.
KAYAK is providing a view into their own data - this information is only across KAYAK sites including kayak.com, sidestep.com, travelpost.com and other KAYAK affiliate sites. However, it does offer good insight into overall search and travel behavior that can help travel industry insiders find the best prospects to target at the right time. Definitely worth a look.