Click, Click: Top Heatmap Solutions to Consider.

Across industries and beyond just CTAs, heatmap solutions help enterprises with tracking visitors to a website and understanding user interactions on a page - where they click, where they exit, where they move their mouse. They can then use this information to test, change or move content and CTAs to better highlight information the brand wants to push. Let's explore top heatmap solutions to consider.
Hotjar
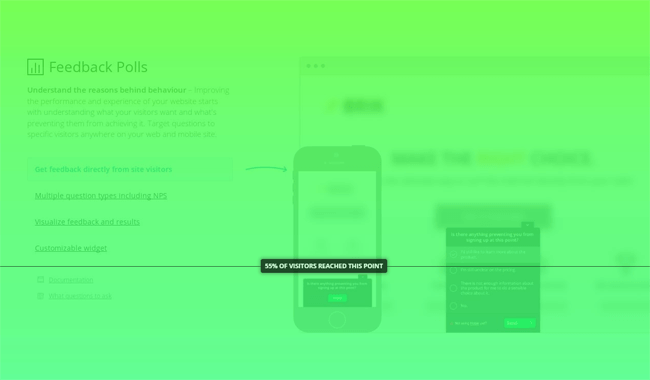
Companies can see visitor behavior with Hotjar, which offers a number of different data visualizers including click, move and scroll heatmpas as well as heatmaps split by device type. With scroll heatmaps, for example, users can see that X percent of visitors reached a certain point (often showing much fewer visitors reaching points below the "fold").

Sumo
Sumo empowers marketers to understand what is happening on every one of their landing pages to correct their websites where needed. Sumo provides a helpful spreadsheet here, which lists the questions brands should be asking with the heatmap data they receive.Questions include:
- How many visitors make it past your first fold?
- How many visitors make it past 75% of your page?
- What is clicked the most on your page?
- What CTA/Navigation receives the least clicks?
- Does your main CTA have the most clicks on the page? Why or why not?
- Are they clicking non-linked images?
- Are they clicking the navigation too much?
Answering these questions for each landing page with heatmap data can help prove the value of the solution chosen by making adjustments based on the observations that lead to better conversion rates.
Crazy Egg
A popular heatmap solution, Crazy Egg set the foundation for what heatmaps should offer (where do people click, where they don't; how many people scroll down and where most people stop). Crazy Egg differs by providing insights into where those people are coming from (e.g., Google, Facebook, etc.) and who clicks the most as well.
Clicktale
Clicktale provides both a statistical and visual overview of visitors' hovers, clicks, hesitation time and visit order. One way the provider differentiates its offering is with side-by-side visualizations of user behavior to understand how split tests are performing.
HeatMap
HeatMap captures users' interactions and shows the data directly on the content to allow site owners/marketers/designers to see what elements are aiding in conversions and interest and what are not. Business users of Heatmap simply browse their own website to access HeatMap data that is updated in real-time.
Click, Click
Whichever solution is chosen for its heatmap capabilities, enterprises should list the questions they have about each individual page to leverage the answers heatmaps provide to understand how visitors are moving through the pages to conversion or to exit.

Subscribe to Our Newsletter!
Latest in Software


